Just as more than 95% of climate scientists accept the truth of climate change, most corporate leaders recognize that their role in society has changed. Businesses know they have to go beyond reducing the incidental damage they do to the planet and actively join in building more just and prosperous communities. Especially if they want to succeed long-term.
In the past few years, energy economics have flipped to the point where renewables are cheaper than fossil fuels. Companies have also discovered that happy, healthy employees, customers and communities create healthier markets – and happier shareholders.
More than ever, Canadian companies are getting this message. Since 2002, Corporate Knights’ ranking of Canada’s Best 50 Corporate Citizens has been tracing public and private companies as well as Crown corporations with more than $1 billion in revenues. Our researchers probe 25 key performance indicators (KPIs) to assess how firms manage their resources, employees and finances in comparison to their peer group, with 50% of each company’s score tied to the percentage of their revenue and investments that qualify as sustainable. For the Best 50, that percentage keeps climbing.
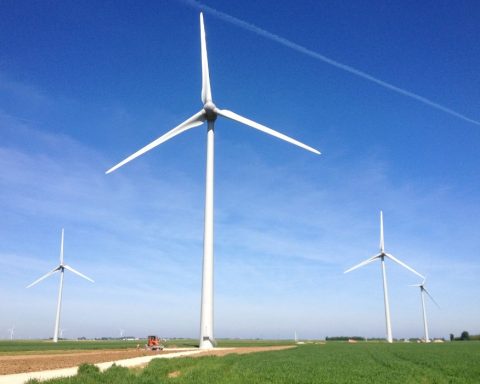
Tellingly, the 2023 list is dominated by renewable-energy players high in sustainable revenue. Topping the Best 50 this year (up from second place in 2022 and 20th in 2021) is a pure-play clean energy company: Innergex Renewable Energy. The Longueuil, Quebec–based renewable-power producer operates 40 hydroelectric facilities, 35 wind farms, 11 solar farms and one energy-storage facility in Canada, the U.S., France and now Chile. It has 11 more projects in the works (see page 52 for profile). In fact, Innergex is the only pure-play renewable-energy company on the Best 50 (giving it 100% sustainable revenue). The company has also continually improved on its disclosure of environmental indicators, which helped it climb to the top of the ranking.
In second place this year (up from third in 2022 and 14th in 2021) is Brookfield Renewable Partners, the renewable-energy platform of Brookfield Corporation, the former Brascan empire (which got its start providing electricity in Brazil). With a market cap of $20.2 billion, more than seven times Innergex’s $2.7 billion, Brookfield Renewable produces 25,400 megawatts of electricity through hydro, wind and solar facilities in Canada, the U.S., Colombia, Brazil, Europe and Asia. The company’s latest annual report says it’s also focusing on investing in “emerging transition asset classes” such as carbon capture and storage, recycling and biogas, “where our initial investment positions us for potential future large-scale decarbonization investment.”
In third place is Hydro-Québec, which was the top company in 2022, 2021 and 2018. While the company largely maintained its sustainable revenue from last year, competition is growing fiercer as more renewable-energy companies jump ahead.
The “most improved” company on the list is Canadian National Railway. It climbed from 35th place to seventh this year thanks to a notable increase in investments mainly aimed at rail network safety and integrity, as well as track infrastructure network resiliency and information technology initiatives. These investments totalled $2.5 billion, or 85% of CN’s total investments, in 2021.
Edmonton engineering firm Stantec scored highest on the Best 50 when it came to the percentage of its executives’ variable pay linked to sustainability targets. With 26,000 employees and 350 offices on six continents, CEO Gord Johnston says the fast-growing company has been focused on building better communities for more than a decade. Initially, “community” meant including parks or public artworks in urban projects or adding water parks to water treatment plants. But over time it came to encompass designing buildings for mental health, promoting accessibility standards far beyond those of local building codes, and partnering with Indigenous communities to stimulate economic development. Johnston says that “we scaled community” to include not just cities, but whole countries, the world and the climate.
How does your company or employer compare to the Best 50?
Here are a few indicators to consider. The average percentage of sustainable revenues achieved by 2023 Best 50 companies is 46.3%, up from 36.8% in 2022, and nearly 10 times the 5% earned by the average large Canadian company (ALCC). They’re sinking more investment money into the green economy, too: the percentage of total investment dollars put toward sustainable investments is just shy of 50% for this year’s Best 50, up from 33.8% in 2022 – and eight times greater than the ALCC’s 6%. Some 78% of Best 50 companies link executive pay to sustainability goals, versus just 40% of other companies.
On the diversity front, the numbers are still far from where they need to be, but the average Best 50 firm has achieved executive gender diversity of 26.8%, versus 21% for the ALCC. The boards of directors of Best 50 companies have a gender diversity rate of 39.3%, versus 31% for the ALCC.Companies are even further behind when it comes to hiring racially diverse leadership.Though board racial diversity among Best 50 companies improved slightly from 8.8% last year to 11.7% this year, executive racial diversity dropped from 12% to 10.6% this year.
Best 50 vs. the rest
How do Canada’s Best 50 Corporate Citizens stack up against other large Canadian companies?

*Large Canadian companies (with more than $1 billion in annual revenue) excluding the Best 50
Best 50 bring home higher returns
Overall, the data consistently show that shares of the Best 50 outperform their “less-best” industry peers. Corporate Knights researchers compared the stock performance of the public companies on the 2023 Best 50 versus that of the S&P/TSX Composite Index. Since 2002 (the year we published our first Best 50 list), Best 50 companies have rewarded their shareholders with 128% higher returns than the overall composite index. It’s evidence that the “triple bottom line” (profit, people and planet) doesn’t compromise the single bottom line – but expands it.

2023 Best 50 ranking table
| 2023 rank | 2022 rank | Name | Industry group | Final score | Climate commitments |
|---|---|---|---|---|---|
| 1 | 2 | Innergex Renewable Energy Inc | Power generation | A+ | |
| 2 | 3 | Brookfield Renewable Partners LP | Power Generation | A- | SBTi |
| 3 | 1 | Hydro-Québec | Power Generation | A- | |
| 4 | 10 | Société de Transport de Montréal | Transit and ground transportation | A- | |
| 5 | 13 | Stantec Inc | Engineering construction | A- | SBTi, 1.5°C |
| 6* | 14 | The Co-Operators | Insurance companies | B+ | NZAM |
| 6* | 6 | WSP Global Inc | Engineering construction | B+ | SBTi, 1.5°C |
| 7 | 35 | Canadian National Railway Co | Freight transport, all modes | B+ | SBTi, 1.5°C |
| 8 | 17 | Canadian Pacific Railway Ltd | Freight transport, all modes | B+ | SBTi |
| 9 | 12 | Northland Power Inc | Power Generation | B+ | |
| 10 | 7 | Telus Corp | Telecom providers | B | SBTi, 1.5°C |
| 11 | 15 | Vancouver City Savings Credit Union | Banks | B | NZAM, NZBA |
| 13 | 18 | Énergir | Natural gas transmission and distribution | B | |
| 14 | Saskatchewan Telecommunications Holding Corporation | Telecom providers | B | ||
| 15 | 11 | EPCOR Utilities | Power transmission and distribution | B | |
| 16 | 39 | Alectra Inc | Power transmission and distribution | B- | |
| 17 | Greenlane Renewables Inc. | Power Generation | B- | ||
| 18 | 8 | Cascades Inc | Packaging | B- | SBTi |
| 19 | 9 | Toronto Hydro Corporation | Power transmission and distribution | B- | |
| 20 | 4 | BCE Inc | Telecom providers | B- | 1.5°C |
| 21 | 23 | Boralex Inc | Power generation | B- | SBTi |
| 22 | 24 | Cogeco Communications Inc | Telecom providers | B- | SBTi, 1.5°C |
| 23 | 27 | British Columbia Hydro and Power Authority | Power Generation | C+ | |
| 24 | 41 | Gildan Activewear Inc | Textiles and clothing manufacturing | C+ | SBTi |
| 25 | 22 | Royal Canadian Mint | Metal products manufacturing | C+ | |
| 26 | 16 | Transcontinental Inc | Plastic and rubber product manufacturing | C+ | SBTi |
| 27 | 19 | Hydro One Ltd | Power transmission and distribution | C+ | |
| 28 | 20 | EcoSynthetix Inc | Basic inorganic chemicals and synthetics | C+ | |
| 29 | Rogers Communications Inc | Telecom providers | C+ | SBTi | |
| 30 | 26 | Celestica Inc | Semiconductor and electronic components manufacturing | C+ | SBTi |
| 31* | 36 | Desjardins Group | Banks | C+ | 1.5°C, NZAM |
| 31* | 37 | Iamgold Corp | Metal and coal mining | C+ | |
| 32 | 33 | Teck Resources Ltd | Metal and coal mining | C+ | |
| 33* | 25 | IGM Financial Inc | Asset management | C+ | NZAM |
| 33* | 5 | Kruger Products LP | Packaging | C+ | |
| 33* | 21 | Sun Life Financial Inc | Insurance companies | C+ | NZAM |
| 34 | 29 | TransAlta Renewables Inc. | Power generation | C+ | |
| 35 | GFL Environmental Inc | Personal and business services | C | ||
| 36 | The Manitoba Hydro-Electric Board | Power Generation | C | ||
| 37 | Canada Post Corp | Freight transport, all modes | C | SBTi, 1.5 degrees | |
| 38* | 42 | Agnico Eagle Mines Ltd | Metal and coal mining | C | |
| 38* | 31 | Bank of Montreal | Banks | C | NZAM, NZBA |
| 39** | 45 | Manulife Financial Corp | Insurance companies | C | 1.5°C |
| 42 | Canadian Utilities Ltd | Power transmission and distribution | C | ||
| 44 | Canadian Tire Corporation Ltd | Retail, except grocery and auto | C | ||
| 45 | West Fraser Timber Co Ltd | Forest products | C- | SBTi, 1.5 degrees | |
| 46 | 40 | Algonquin Power & Utilities Corp | Power Generation | C- | |
| 48 | 49 | NFI Group Inc | Cars and trucks manufacturing, including parts | C- | |
| 49 | 48 | BGIS | Real estate and leasing | C- | SBTi |
| 50 | 50 | Paper Excellence Canada Holdings Corp | Forest Products | C- |
*Indicates a tie as a result of a formula correction
**Revised rank due to a formula correction
Winding road to sustainability
But for billion-dollar corporations in particular, sustainability is a journey, and progress is rarely predictable. Rogers’ (no. 29) recent takeover of Shaw Communications, for instance, has been roundly criticized for reducing competition in Canada’s telecom industry. (And Rogers’ decision to pay CEO Tony Staffieri $31.5 million during his first year pretty much blows up the company’s CEO-to-employee pay gap). Rogers’ arch-rival, Telus (no. 10), has been embroiled in a recent labour dispute that left its unions bristling. And Teck Resources (no. 32) has recently been in the news for its controversial plan to splinter off its carbon-heavy coal mines, which have become an ESG liability for investors. Though the Vancouver-headquartered company has installed $1.2 billion worth of water treatment technology in the Elk Valley, “chronic toxicity impacts” persist in Elk Valley waters, according to the B.C. government.
Nonetheless, all three of these companies earned their Best 50 rankings. Teck scored highly in relation to its peers in part because 6.8% of its revenue comes from recycled minerals and minerals needed for the low-carbon transition. Rogers secured the 29th position because 55% of its investments involve improving telecommunications infrastructure, a key component of the energy transition. Rogers also earned points for its energy-efficient data centres and its refurbishing and recycling of used devices. Telus earned 10th spot, as it scored highly against its peers on sustainable revenue and sustainable investment as well as on all four diversity metrics. No company makes the right decision every time. But two decades into the Best 50, the ranking proves that a large number of Canadian companies are willing to evolve and invest in a cleaner, more equitable future.
The real bottom line is that business and the planet constitute a closed ecosystem – in this fragile biosphere the smartest companies know that putting sustainability first is the ultimate key to lasting success.
Rick Spence is a business journalist and senior editor at Corporate Knights.
Climate commitments legend
1.5°C: Business Ambition for 1.5C
SBTi: Science Based Targets initiative
FCCA: Fashion Charter for Climate Action
NZAM: Net-Zero Asset Managers Initiative
NZAO: Net-Zero Asset Owners Alliance
NZBA: Net-Zero Banking Alliance
Key performance metrics
All companies are scored on applicable metrics relative to their peers, with 50% of the weight assigned to sustainable revenue and sustain- able investment. Nine of the 25 indicators have fixed weights; the rest are assigned weights according to each industry’s relative impact in relation to the overall economy.
Sustainable revenue: % of total revenue derived from products and services categorized as “sustainable” under the Corporate Knights Sustainable Economy Taxonomy
Sustainable investment: % of total investments in assets categorized as “sustainable” under the Corporate Knights Sustainable Economy Taxonomy
Board/executive gender diversity: % of non- male board members and executives
Board/executive racial diversity: % of racially diverse board members and executives
Sustainability pay link: Link between senior executives’ variable compensation and sustainability-themed performance targets
Taxes paid: Based on company’s ratio of cash taxes paid to profit over past five years
Paid sick leave: 10 or more paid sick-leave days per year
Pension fund status: A series of calculations assessing the generosity/viability of defined contribution/defined benefit plans
Energy/carbon/waste/waste productivity: $ revenue per unit (gigajoule/tonne/cubic metre/ tonne of waste) of non-renewable energy consumption, direct/indirect CO2e, freshwater withdrawal, non-recycled waste produced
VOC/NOx/SOx/PM productivity: $ revenue per tonne of VOC, NOx, SOx and particulate matter emissions
CEO–average worker pay: How much more CEO gets paid (expressed as multiple com- pared to average worker)
Supplier score: Sustainability score of a com- pany’s largest supplier by spend
Financial sanctions: Total fines, penalties and settlements as % of revenue
Fatalities: Fatalities per total employee count Injuries: Lost-time injuries per 200,000 work hours
Turnover: Number of departures divided by the average total employees

| *Indicates a tie as a result of a formula correction |