Of all the companies in the world that embrace sustainable business practices, Europe has long claimed a disproportionate share of the best and most ambitious. For 20 years, Corporate Knights has rated and ranked the most sustainable corporations globally, and European companies have consistently earned top marks.
It should come as little surprise, then, that in Corporate Knights’ inaugural Europe 50 ranking, the top company, Schneider Electric, also achieved the highest marks in the 2025 Global 100 ranking. The French company is the only one to have topped the Global 100 twice (the other time back in 2021), and it has played a unique role in electrification efforts across a wide variety of sectors, from manufacturing light switches to pioneering new software and clean energy solutions for data centres and smart cities. Today, 74% of its €54 billion in annual revenue comes from sustainable sources, and nearly 80% of its sizeable investment portfolio has been directed into sustainable solutions.
For a company with offices in more than 100 countries and a 180-year history, these movements are a bellwether for the rest of the world. Last year, Schneider Electric joined luxury fashion group Hermès and cosmetic giant L’Oréal as one of the five largest companies in France. Its shares jumped 58% in 2024, and its market capitalization peaked in January at €152 billion.
But for Corporate Knights publisher Toby Heaps, the most interesting thing about this rise is the inflection point it represents: Schneider Electric’s valuation leapfrogged France’s largest oil and gas producer, TotalEnergies, for the first time.
“A few years ago, the sustainable economy was a niche thing,” Heaps says. “Now it’s the main game, and it’s going to determine who wins and loses, who rises and falls.” If you want to know how that game is playing out, Europe is a telling indicator.
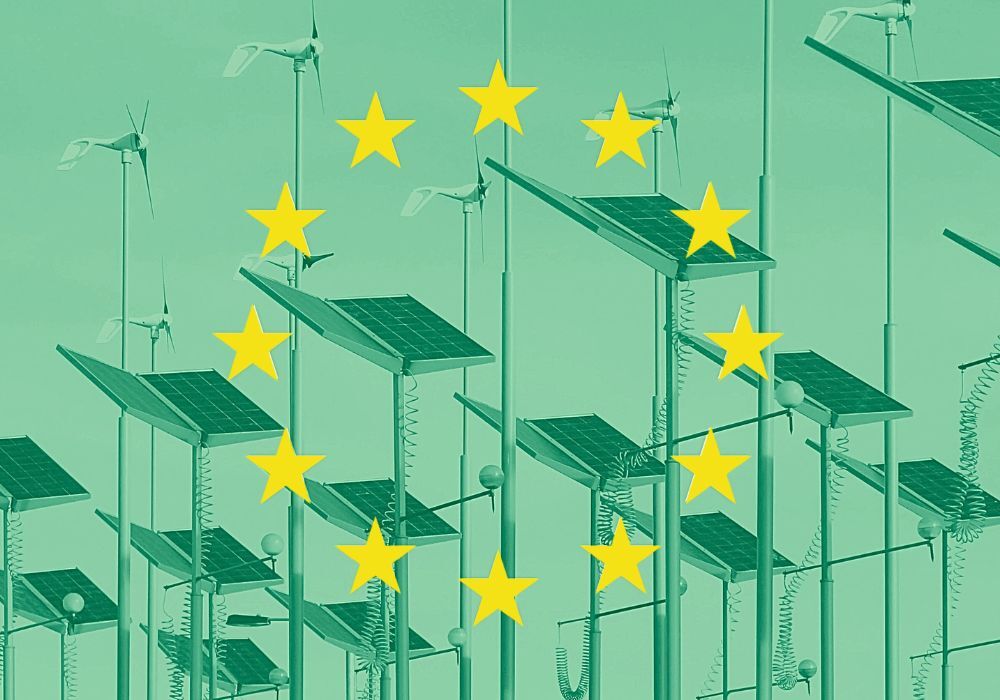
50 companies, 31 industries, 14 countries
In many rankings of how companies perform on environmental, social and governance (ESG) factors, there is a tendency for “pure play” clean energy companies – or those with a sole specialization in renewables – to dominate. In the Corporate Knights methodology, revenue from sustainable sources and sustainable investment together account for half of the total score that then determines rankings. But critically, the evaluation criteria are relative. “We do not compare the performance of a bank against the performance of a mining company; we compare it against other banks,” explains Michael Yow, the director of ratings for Corporate Knights.
In the Global 100, as in other indices like the MSCI ACWI index, there are also a designated number of industry-specific spots. This not only helps avoid overrepresentation; it also makes the rankings a useful point of comparison.
The Europe 50 ranking has no industry allocations, however; it is a straight ranking. Even so, the list exhibits exceptional diversity. “I would be concerned if there were 12 or 15 companies from one industry, but that’s not the case,” Yow says.
Power generation does appear most often, with six companies making the ranking, including highly rated companies from the 2025 Global 100 like Vestas, the Danish wind-power generator, which earned the top spot in the Global 100 in 2022. But there are 30 other industries represented on the Europe 50, including retailers, a wide variety of manufacturers, pharmaceutical companies, real estate companies, IT companies and more.
Take Mercedes-Benz, the only auto manufacturer on the Europe 50, which has made exceptional strides in electrifying the luxury vehicle market. Or Puma, the German sports apparel giant whose products are made, on average, of 22% recycled materials. Or Outokumpu Oyj, the Finnish steel manufacturer, which produces nearly 90% of its stainless steel sustainably and has made significant investments in new sustainability initiatives.
Other notable placements from the ranking include Pirelli, the Milan-based tire manufacturer, and Pentair, the London-based metal products company; both scored highly for the racial diversity of their boards. Unilever, the multinational consumer goods company, earned a high score for the racial diversity of its executives. Severn Trent, the U.K. wastewater treatment company, scored highly for female representation at both the executive and board levels.
The European outlook
What explains the outsized influence of European companies amidst this shift toward sustainability in global affairs? How do we make sense not only of the outsized presence of European companies on the Global 100 ranking, but also the tremendous diversity of companies on the Europe 50? There are a few key factors, Heaps suggests. The first is the regulatory environment. Rules around disclosure of sustainability performance simply do not exist to the same extent anywhere outside of Europe.
Regulations on what kinds of labels can be used, and even what kinds of products can be manufactured, for example, extend to performance, Yow explains: “Companies have to perform well on sustainability because it’s the law.”
Another key factor is leadership. Denmark has a population of just six million people, yet seven Danish companies won positions on the Europe 50. Only the United Kingdom had as many companies represented, and its population is more than 10 times that of Denmark’s. “They always punch above their weight,” Heaps says.
As of 2021, 25% of Denmark’s largest 100 companies – and 60% of the country’s stock market capitalization – are controlled by “industrial foundations,” a unique feature of the Danish economy. The controlling interest of these companies is focused not exclusively on profits, but on fostering societal advancements, innovation and long-term thinking. These companies are, in other words, operating on different time horizons by design. While the dominant Western paradigm has focused exclusively on shareholder returns to the exclusion of “externalities” like planetary and human health, the European approach is achieving a broader range of benefits and still paying off.
“Over the past five years, sustainable revenues of European companies are growing at twice the rate of all other revenues,” Heaps says. Corporate Knights will be tracking the financial performance of the Europe 50 on a go-forward basis.
The unstoppable shift toward more sustainable business models is driven primarily by sound business practices, which also happen to prioritize the planet and its people. These European companies are lighting a path that is not only more sustainable and sensible, but also more rewarding.
Tristan Bronca is a writer and editor in Newmarket, Ontario.
| Rank | Company | Peer group | % Sustainable revenue | % Sustainable investment | Overall grade |
|---|---|---|---|---|---|
| 1 | Schneider Electric SE | Electrical equipment manufacturing | 74.0% | 79.4% | A+ |
| 2 | Vestas Wind Systems A/S | Machinery Manufacturing | 100.0% | 100.0% | A |
| 3 | SMA Solar Technology AG | Semiconductor and electronic components manufacturing | 100.0% | 100.0% | A |
| 4 | Alstom SA | Non-road transport equipment manufacturing | 98.7% | 83.6% | A- |
| 5 | Orsted A/S | Power Generation | 76.0% | 97.2% | A- |
| 6 | Signify NV | Electrical equipment manufacturing | 85.0% | 61.7% | A- |
| 7 | ERG SpA | Power Generation | 83.4% | 100.0% | B+ |
| 8 | United Utilities Group PLC | Water and sewage treatment | 50.8% | 100.0% | B+ |
| 9 | Nordex SE | Machinery Manufacturing | 100.0% | 100.0% | B |
| 10 | Trane Technologies PLC | HVAC equipment manufacturing | 45.0% | 17.8% | B |
| 11 | Unibail-Rodamco-Westfield SE | Real estate and leasing | 70.1% | 32.1% | B |
| 12 | Dassault Systemes SE | IT services except telecom and hosting | 67.3% | 0.0% | B |
| 13 | Neste Oyj | Refining, petrochemicals and basic organic chemicals | 34.0% | 87.7% | B |
| 14 | Severn Trent PLC | Water and sewage treatment | 78.9% | 80.4% | B |
| 15 | Kone Oyj | Machinery Manufacturing | 49.3% | 30.9% | B |
| 16 | Getlink SE | Freight transport, all modes | 70.4% | 97.4% | B |
| 17 | Nokia Oyj | Telephones and telecom equip manufacturing | 47.3% | 38.5% | B |
| 18 | NKT A/S | Electrical equipment manufacturing | 68.0% | 66.1% | B |
| 19 | Kesko Oyj | Grocery stores | 4.7% | 13.5% | B |
| 20 | Acciona SA | Commercial building construction | 58.7% | 89.3% | B |
| 21 | Johnson Controls International PLC | HVAC equipment manufacturing | 57.4% | 32.8% | B |
| 22 | Essity AB | Packaging | 66.7% | 15.0% | B |
| 23 | Kering SA | Retail, except grocery and auto | 39.6% | 9.6% | B- |
| 24 | Verbund AG | Power transmission and distribution | 56.1% | 91.7% | B- |
| 25 | Outokumpu Oyj | Steel making | 87.3% | 76.8% | B- |
| 26 | Novonesis A/S | Pharmaceutical and biotech manufacturing | 81.4% | 52.9% | B- |
| 27 | Atea ASA | Computers and peripherals manufacturing | 56.6% | 21.7% | B- |
| 28 | Land Securities Group plc | Real estate and leasing | 52.8% | 0.5% | B- |
| 29 | EDP Renovaveis SA | Power Generation | 99.8% | 99.8% | B- |
| 30 | Pandora A/S | Furniture and general manufacturing | 97.0% | 0.1% | B- |
| 31 | Corporacion Acciona Energias Renovables S.A. | Power Generation | 54.5% | 96.4% | B- |
| 32 | SAP SE | IT services except telecom and hosting | 21.4% | 0.7% | B- |
| 33 | Pirelli & C SpA | Plastic and rubber product manufacturing | 22.5% | 12.1% | B- |
| 34 | Prysmian SpA | Electrical equipment manufacturing | 39.7% | 65.5% | B- |
| 35 | PNE AG | Machinery Manufacturing | 72.6% | 100.0% | B- |
| 36 | Novo Nordisk A/S | Pharmaceutical and biotech manufacturing | 3.5% | 42.5% | B- |
| 37 | Tele2 AB | Telecom providers | 8.6% | 90.5% | B- |
| 38 | Iberdrola SA | Power Generation | 30.3% | 89.2% | B- |
| 39 | Beazley PLC | Insurance companies | 11.1% | B- | |
| 40 | Umicore SA | Basic inorganic chemicals and synthetics | 13.6% | 67.4% | B- |
| 41 | Rockwool A/S | Glass and ceramics | 57.4% | 75.3% | B- |
| 42 | Telefonaktiebolaget LM Ericsson | Telephones and telecom equip manufacturing | 44.6% | 49.1% | B- |
| 43 | AB Ignitis Grupe | Power Generation | 23.1% | 95.0% | C+ |
| 44 | Acerinox SA | Steel making | 60.2% | 36.5% | C+ |
| 45 | Unilever PLC | Personal products (retail chemical) | 3.4% | 0.5% | C+ |
| 46 | FirstGroup PLC | Freight transport, all modes | 81.4% | 43.4% | C+ |
| 47 | Intesa Sanpaolo SpA | Banks | 11.2% | C+ | |
| 48 | Mercedes-Benz Group AG | Cars and trucks manufacturing, including parts | 13.7% | 14.2% | C+ |
| 49 | Puma SE | Textiles and clothing manufacturing | 22.0% | 0.1% | C+ |
| 50 | Pentair PLC | Metal products manufacturing | 67.2% | 24.1% | C+ |