Michael Sivak, a research professor at the University of Michigan's Transportation Research Institute, has done a great job of tracking driving, transit and car-ownership trends in the United States. His latest paper gives us a detailed look at who's commuting — as well as how and when — in America's 30 largest cities. With this research, we learn that New Yorkers have the longest commute times, Boston has the highest percentage of residents walking to work, Louisville, Kentucky, has the highest percentage of residents driving to work alone, and Portland has the highest percentage of residents working from home and cycling to work.
Corporate Knights has put some of the data recently released by Sivak into two handy spreadsheets you can use to rank cities on each indicator from highest to lowest.
| City | Population | Median Earnings $ | % Workers w/o Vehicles | % Who Work At Home | % Who Drive Alone to Work | % Who Carpool | % Who Take Transit to Work | % Who Walk to Work | % Who Bicycle to Work | Mean Travel to Work (Min) |
|---|---|---|---|---|---|---|---|---|---|---|
| Austin, TX | 885400 | 33,304 | 4.2 | 7.1 | 73.7 | 9.9 | 4.2 | 2.4 | 1.4 | 23.5 |
| Baltimore, MD | 622104 | 35,706 | 15.9 | 2.5 | 61.3 | 9.2 | 18.8 | 6.4 | 0.7 | 30.5 |
| Boston, MA | 645966 | 37,674 | 21.9 | 3.4 | 40.6 | 5.4 | 33 | 14.5 | 1.9 | 29.5 |
| Charlotte, NC | 792862 | 31,979 | 4.5 | 5.8 | 75.5 | 10.7 | 4 | 2.2 | 0.3 | 24.1 |
| Chicago, IL | 2718782 | 34,518 | 16.4 | 4.4 | 49.7 | 8.5 | 27.8 | 6.7 | 1.4 | 33.7 |
| Columbus, OH | 822553 | 31,774 | 3.6 | 3.6 | 79.3 | 9.2 | 3.3 | 2.8 | 1 | 21.4 |
| Dallas, TX | 1257676 | 30,208 | 4.3 | 4.4 | 75.8 | 11.8 | 3.8 | 1.9 | 0.3 | 25.8 |
| Denver, CO | 649495 | 35,831 | 4.3 | 7 | 69.8 | 8.3 | 7.4 | 4.5 | 2 | 24.8 |
| Detroit, MI | 688701 | 22,888 | 11.5 | 3.8 | 70.1 | 11.9 | 8.1 | 3.5 | 0.6 | 26.8 |
| El Paso, TX | 674433 | 25,021 | 2 | 3.1 | 79.5 | 11.4 | 1.7 | 1.6 | 0.1 | 22.1 |
| Fort Worth, TX | 792727 | 31,815 | 1.8 | 3.7 | 80.9 | 11.1 | 0.8 | 1.2 | 0.2 | 26.5 |
| Houston, TX | 2195914 | 30,252 | 4.6 | 3.7 | 75.3 | 12.2 | 4.2 | 2.2 | 0.8 | 26.3 |
| Indianapolis, IN | 843393 | 30,372 | 3.7 | 3 | 81.2 | 10.2 | 2.3 | 1.9 | 0.4 | 22.6 |
| Jacksonville, FL | 842583 | 31,715 | 3.2 | 4.4 | 81.4 | 9.1 | 1.6 | 1.4 | 0.4 | 24.3 |
| Las Vegas, NV | 603488 | 30,411 | 4.1 | 2.9 | 76.7 | 12 | 4.5 | 1.8 | 0.4 | 24.9 |
| Los Angeles, CA | 3884307 | 27,550 | 6.8 | 5.4 | 67.1 | 9.9 | 10.8 | 3.6 | 1.2 | 29.9 |
| Louisville, KY | 609893 | 31,466 | 4.9 | 2.4 | 82.9 | 8.2 | 2.7 | 2.1 | 0.5 | 21.6 |
| Memphis, TN | 653450 | 28,373 | 4.9 | 2.1 | 79.5 | 12.4 | 2.2 | 2.2 | 0.4 | 21.9 |
| Nashville, TN | 634464 | 31,371 | 2.8 | 4.9 | 81.1 | 8.5 | 1.9 | 2.3 | 0.3 | 23.3 |
| New York, NY | 8405837 | 37,333 | 46 | 4.1 | 21.4 | 4.9 | 56.7 | 10 | 1.2 | 39.7 |
| Oklahoma City, OK | 610613 | 30,667 | 2.5 | 3 | 82.6 | 11.3 | 0.7 | 1.3 | 0.3 | 20.7 |
| Philadelphia, PA | 1553165 | 31,852 | 18.9 | 2.9 | 49.9 | 8.5 | 27.2 | 8.1 | 2.3 | 32 |
| Phoenix, AZ | 1513367 | 31,002 | 4 | 4.6 | 74.7 | 12 | 4 | 1.8 | 0.6 | 24.7 |
| Portland, OR | 609456 | 35,903 | 7.1 | 7.1 | 57.4 | 9.9 | 11.9 | 6.1 | 5.9 | 25.3 |
| San Antonio, TX | 1409019 | 27,500 | 4.1 | 3.2 | 78.9 | 11.1 | 3.6 | 1.7 | 0.3 | 23.4 |
| San Diego, CA | 1355896 | 37,280 | 3.2 | 6.2 | 74.9 | 8.7 | 4.2 | 3.7 | 0.8 | 23.3 |
| San Francisco, CA | 837442 | 51,329 | 18.6 | 6.8 | 36.4 | 6.8 | 32.7 | 10.9 | 3.8 | 31.5 |
| San Jose, CA | 998537 | 42,022 | 1.8 | 3.9 | 75.8 | 11.8 | 4.5 | 1.7 | 1 | 27.3 |
| Seattle, WA | 652405 | 46,125 | 8.5 | 6.7 | 50.5 | 8 | 20.9 | 9.1 | 3.5 | 26.2 |
| Washington, DC | 646449 | 52,310 | 27.7 | 4.4 | 32.3 | 5.3 | 38.5 | 13.6 | 4.5 | 29.9 |
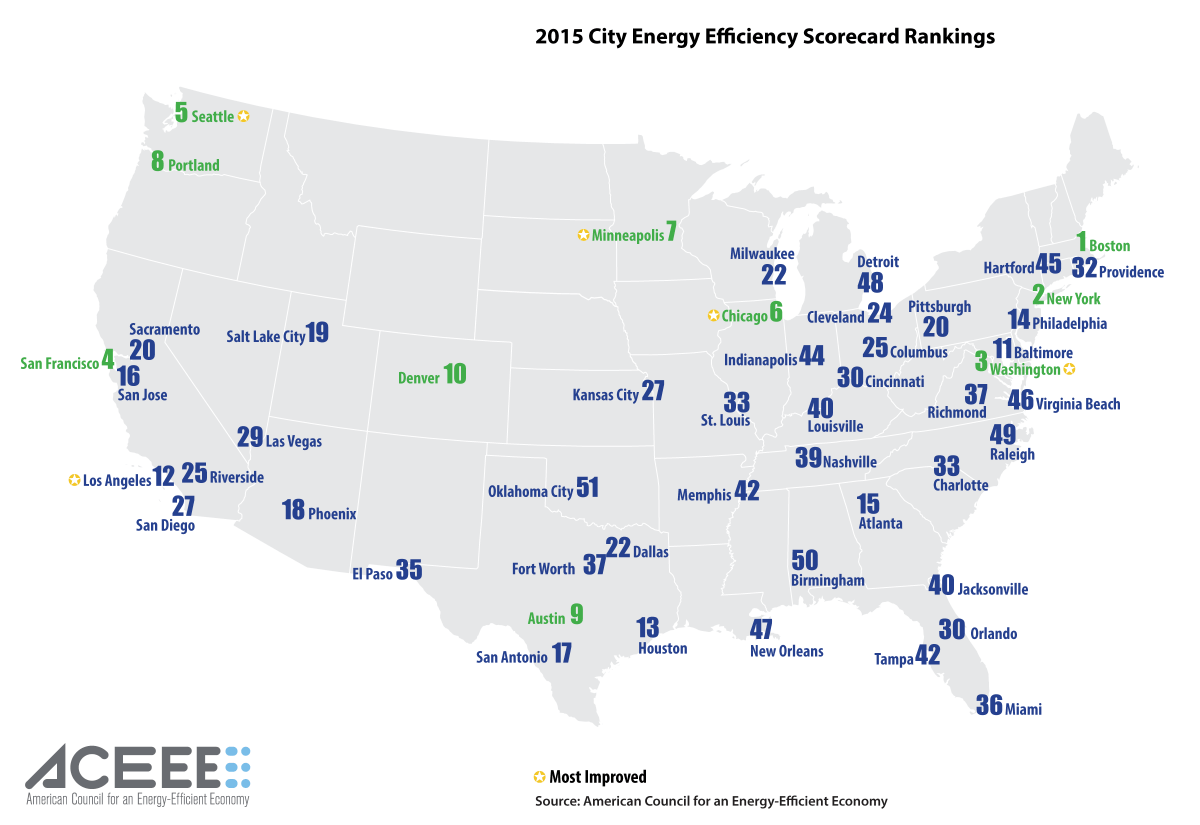
Also recently released, the American Council for an Energy-Efficient Economy (ACEEE) has put out its 2015 City Energy Efficiency Scorecard, which ranks Boston as the most efficient city in the United States, followed by New York City and Washington, DC. The least efficient? That title goes to Birmingham, Alabama, though Raleigh, Detroit and New Orleans also landed at the bottom of the pack. The ACEEE report goes into great detail explaining its scoring methodology, which is based on an assessment of five policy areas: local government operations, city-wide initiatives, building policies, performance of energy/water utilities, and transportation policies.
Washington, Los Angeles, Chicago, Minneapolis, and Seattle were the most-improved cities compared to the last edition, with many showing double-digit scoring improvements. "The increased availability of their policy data accounted for some of their improvement, but these cities also have made real strides in efficiency," according to the report. "Chicago, for example, enacted a new commercial benchmarking ordinance. Los Angeles is another good example. Whereas California requires municipal utilities to achieve 10 per cent of their supply through energy efficiency by 2023, Los Angeles’ municipal utility adopted a more stringent target of 15 per cent by 2020."
Below you'll find a map showing each city's ranking. Click to enlarge and see full map.