Media Release
Toronto, Canada, January 19, 2022 – Corporate Knights’ 18th annual ranking of the world’s 100 most sustainable corporations shows a continued correlation between higher investor returns and strong performance on key environmental, social and governance (ESG) metrics. It also sheds light on the evolution of ESG priorities and outcomes, and on the extent of the gap between leading sustainability performers and their global corporate peers.
The ranking is based on a rigorous assessment of 6,914 companies with more than US$1 billion in revenues, out of which Vestas Wind Systems of Denmark emerged as the world’s most sustainable corporation.
Vestas has evolved from hydraulic crane production into the largest of all wind turbine manufacturers, responsible for nearly one-fifth of global installed wind power capacity. In December it began work on a North Sea turbine that will be Europe’s most powerful and Scotland’s largest renewable energy project. The company’s current focus is on lowering the carbon footprint associated with its turbines.
“Through our solutions, Vestas supports the global energy system with avoiding millions of tonnes of carbon emissions every year,” says CEO Henrik Andersen. “To build a truly sustainable future, however, we must do more,” he adds.
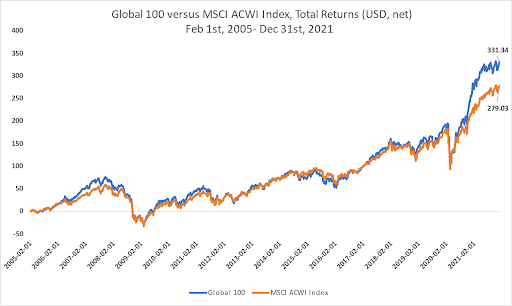
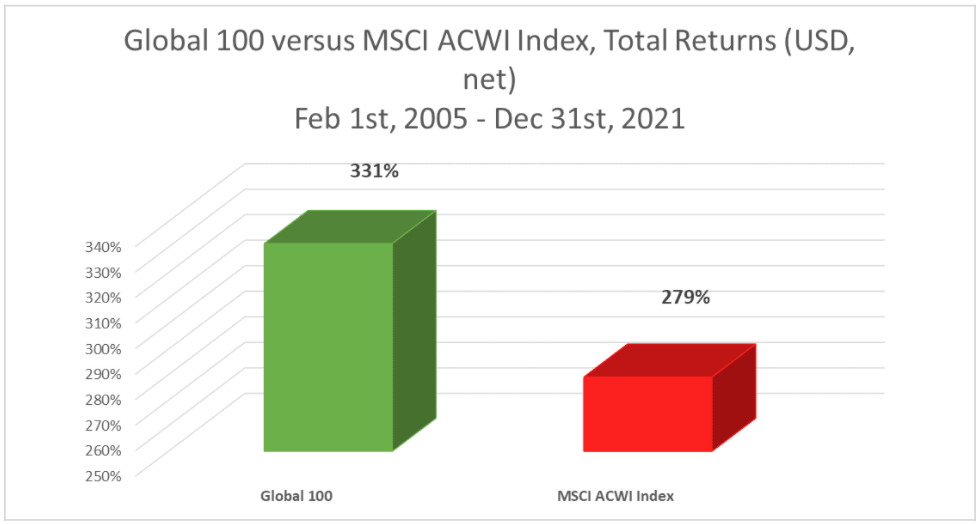
According to analysis by S&P Capital IQ, the Corporate Knights Global 100 Index is the best performing global sustainability equity index since its inception in 2005and is also ahead of its blue-chip benchmark. A dollar invested in an index composed of Global 100 companies on February 1, 2005, would have generated a return nearly one-fifth larger than the same investment in the MSCI All Country World Index, or ACWI (total return of 331% compared to 279%), with the performance gap widening in favour of the Global 100 markedly after the onset of COVID as large green recovery programs were adopted.
The 2022 Global 100 companies derive 47% of their earnings from products or services categorized as “clean” under the Corporate Knights Clean Taxonomy, and they direct 48% of their capital expenditures, R&D and acquisitions to clean investments.
Compared to the average ACWI firm, Global 100 members generate more than four times as much revenue per tonne of carbon emitted and almost eight times more output per unit of energy consumed.
“Strong performance on these metrics is foundational to achieving a clean and carbon-neutral economy in the necessary time frame,” says Corporate Knights CEO Toby Heaps, “and the sustained momentum is encouraging.”
While Global 100 companies made progress boosting their share of clean revenues and investments, non-male representation among directors stalled this year at 32%. And there was middling performance on percent of taxes paid, with cash taxes paid being 13% of profit ratio over the past five years, in contrast to average global statutory rates that are double that. This suggests that room remains for leading performers to emerge on some of these more recent ESG focal points.
Other noteworthy findings and outcomes of this year’s analysis:
- Circularity is a heightened focal point for many Global 100 companies, such as newly ranked Schnitzer Steel Industries of the United States, which specializes in steel and auto recycling.
- 65 of the Global 100 companies have signed up to the Science Based Targets initiative, aligning their emissions reductions with the requirements of the Paris Agreement, up from 60 in 2021.
- Some companies dropped off the Global 100 in light of performance that no longer aligns with stricter criteria for what qualifies as “clean.” For example, cars must be fully electric now to qualify, whereas in prior years, hybrids were counted as clean. This had a negative impact on Valeo SA of France, whose products largely go into hybrid rather than battery electric vehicles.
- Some high-profile brands were excluded because of specific red-flagged activities. This includes climate-policy blocking on the part of Ford Motor Company, Daimler AG, Chevron and Air France, based on research from the non-profit Influence Map.
- Sectoral representation is dominated by various tech segments, including telecoms, chipmakers, computer makers and business service providers, while 10 banks make up the largest single sector.
- The U.S. has the largest number of Global 100 companies at 23, with Canada punching above its weight with 13. Another three come from South America, 41 from Europe/U.K., and 20 from the Asia-Pacific Region.
Normally announced at an event concurrent with the World Economic Forum in Davos, this year’s Global 100 launch includes a leaders’ roundtable discussion held virtually, focusing on the imperative for businesses and governments to close the “say–do” gap on climate. This event takes place today from 4 to 5pm Central European Time with opening remarks from Johan Rockström, a Swedish professor and joint director of the Potsdam Institute for Climate Impact Research, and the involvement of:
- Henrik Andersen, CEO, Vestas Wind Systems A/S
- Jean-Pascal Tricoire, CEO, Schneider Electric SE
- Mads Nipper, CEO, Ørsted A/S
- Esther An, Chief Sustainability Officer, City Developments Limited
- Hakan Bulgurlu, CEO, Arçelik AS
- Lawrence Kurzius, CEO, McCormick & Company Inc.
- Roberto Guidetti, CEO, Vitasoy International Holdings Ltd.
Free registration is available at https://tinyurl.com/G1002022.
A digital version of the ranking, select national scorecards, and further contextual and methodological information is available at corporateknights.com/global100.
What is the Global 100? Corporate Knights’ ranking of the world’s 100 most sustainable corporations is based on a rigorous assessment of nearly 7,000 public companies with revenue over US$1 billion. The Corporate Knights Global 100 methodology strives to measure what matters and our methodology is transparent and verifiable. We’ve been conducting rigorous research on environmental, social and governance (ESG) factors for two decades. Our ESG indicators are radically transparent, enabling a clear understanding of our ratings.
Our analysis illuminates the “say–do” gap. Thousands of companies have made net-zero commitments, but only a small percentage have credible, science-based plans to decarbonize their operations and supply chains. By researching companies’ capital expenditures, income earned from clearly defined sustainable activities, research and development/implementation of innovative low-carbon technologies, and mergers and acquisitions, we’re able to determine if they are aligning their money with their public relations. Only those companies making sustainable solutions a core part of their business offerings and allocating meaningful investments to reduce their carbon footprints make the grade.
The Global 100 is the top-performing global sustainability index. The index has consistently outperformed the MSCI ACWI since its inception, and the gap has widened significantly since we’ve allocated 50% of our grade to how companies make and invest their money, with particular emphasis on those closing the say–do gap on decarbonization. Our methodology measures what matters: sustainability.
Global 100 Methodology: All companies are scored on applicable metrics relative to their peers, with 50% of the weight assigned to Clean Revenue and Clean Investment. Nine of the indicators have fixed weights; the rest are assigned weights according to each industry’s relative and total impact in relation to the overall economy. After quantitatively analyzing data for 23 key performance indicators, this year’s overall scores were converted to letter grades.
About Corporate Knights: Corporate Knights Inc. includes the sustainable-business magazine Corporate Knights and a research division that produces rankings and financial product ratings based on corporate sustainability performance.
Contact information:
Toby Heaps, CEO, Corporate Knights
Phone: +1 (416) 274.1432 Email: toby@corporateknights.com
Appendix I: Net returns of the MSCI ACWI and the Corporate Knights Global 100 Index in USD as calculated respectively by Solactive and S&P Capital IQ (from February 1, 2005, to December 31, 2021).
Appendix II: 2022 Global 100 Most Sustainable Corporations in the World
| 2022 G100 Rank | 2021 G100 Rank | Company | Headquarters City | Climate commitments | Overall Score |
|---|---|---|---|---|---|
| 1 | 21 | Vestas Wind Systems A/S | Aarhus | 1.5°C, SBTi | A+ |
| 2 | 24 | Chr Hansen Holding A/S | Horsholm | 1.5°C, SBTi | A |
| 3 | 43 | Autodesk Inc | San Rafael | SBTi | A |
| 4 | 1 | Schneider Electric SE | Rueil-Malmaison | 1.5°C, SBTi | A |
| 5 | 40 | City Developments Ltd | Singapore | 1.5°C, SBTi | A |
| 6 | 9 | American Water Works Company Inc | Camden (U.S.) | A | |
| 7 | 2 | Orsted A/S | Fredericia | 1.5°C, SBTi | A- |
| 8 | 12 | Atlantica Sustainable Infrastructure PLC | Brentford (U.K.) | SBTi | A- |
| 9 | 55 | Dassault Systemes SE | Vélizy-Villacoublay | 1.5°C, SBTi | A- |
| 10 | 18 | Brambles Ltd | Sydney | 1.5°C, SBTi | A- |
| 11 | 57 | Sims Ltd | Mascot | A- | |
| 12 | 38 | Johnson Controls International PLC | Cork | 1.5°C, SBTi | B+ |
| 12* | 7 | Kering SA | Paris | SBTi, FCCA | B+ |
| 13 | 93 | Koninklijke KPN NV | Rotterdam | 1.5°C, SBTi | B+ |
| 14 | 6 | McCormick & Company Inc | Hunt Valley | SBTi | B+ |
| 15 | Schnitzer Steel Industries Inc | Portland | B+ | ||
| 16 | 45 | Transcontinental Inc | Montreal | B+ | |
| 17 | 5 | Stantec Inc | Edmonton | 1.5°C, SBTi | B+ |
| 18 | 17 | Cascades Inc | Kingsey Falls | SBTi | B+ |
| 19 | Evoqua Water Technologies Corp | Pittsburgh | SBTi | B+ | |
| 20 | Beijing Enterprises Water Group Ltd | Wan Chai | B+ | ||
| 21 | 3 | Banco do Brasil SA | Brasília | 1.5°C, SBTi | B+ |
| 22 | 51 | Sekisui Chemical Co Ltd | Osaka | 1.5°C, SBTi | B+ |
| 23 | Engie Brasil Energia SA | Florianópolis | B+ | ||
| 24 | 4 | Neste Oyj | Espoo | B+ | |
| 25 | 19 | Iberdrola SA | Bilbao | 1.5°C, SBTi | B+ |
| 26 | 70 | Xerox Holdings Corp | Norwalk | SBTi | B |
| 27 | Salesforce.Com Inc | San Francisco | 1.5°C, SBTi | B | |
| 28 | 13 | Cisco Systems Inc | San Jose | 1.5°C, SBTi | B |
| 29 | 39 | Alstom SA | St Ouen | SBTi | B |
| 31† | Legrand SA | Limoges | 1.5°C, SBTi | B | |
| 32 | 16 | Eisai Co Ltd | Tokyo | 1.5°C, SBTi | B |
| 33 | Ecolab Inc | Saint Paul | 1.5°C, SBTi | B | |
| 34 | Canadian Pacific Railway Ltd | Calgary | SBTi | B | |
| 35 | 36 | Novozymes A/S | Bagsvaerd | 1.5°C, SBTi | B |
| 36 | 90 | Alphabet Inc | Mountain View | B- | |
| 37 | 27 | Verbund AG | Vienna | B- | |
| 38 | 95 | Workday Inc | Pleasanton | 1.5°C, SBTi | B- |
| 39 | SunPower Corp | San Jose | B- | ||
| 40 | 8 | Metso Outotec Corp | Helsinki | SBTi | B- |
| 41 | 29 | IGM Financial Inc | Winnipeg | NZAM | B- |
| 42 | Xinyi Solar Holdings Ltd | Wuhu | B- | ||
| 43 | Sprouts Farmers Market Inc | Phoenix | B- | ||
| 44 | 20 | TSMC | Hsinchu City | B- | |
| 45 | 62 | Vitasoy International Holdings Ltd | Hong Kong SAR | B- | |
| 46 | 60 | Samsung SDI Co Ltd | Yongin-Si | B- | |
| 47 | LONGi Green Energy Technology Co Ltd | Xi'an | 1.5°C, SBTi | B- | |
| 48 | Apple Inc | Cupertino | 1.5°C, SBTi | B- | |
| 49 | 54 | Telus Corp | Vancouver | 1.5°C, SBTi | B- |
| 50 | 50 | HP Inc | Palo Alto | 1.5°C, SBTi | B- |
| 51 | Atea ASA | Oslo | SBTi | B- | |
| 52 | 97 | Tesla Inc | Austin | 1.5°C, SBTi | B- |
| 53 | 41 | Konica Minolta Inc | Tokyo | SBTi | B- |
| 54 | 30 | Hewlett Packard Enterprise Co | Houston | 1.5°C, SBTi | C+ |
| 55 | 84 | SAP SE | Walldorf | 1.5°C, SBTi | C+ |
| 55* | 14 | Storebrand ASA | Lysaker | 1.5°C, SBTi, NZAM, NZAO | C+ |
| 55* | 69 | Sun Life Financial Inc | Toronto | NZAM | C+ |
| 56 | Koninklijke Philips NV | Amsterdam | 1.5°C, SBTi | C+ | |
| 57 | 34 | Arcelik AS | Istanbul | 1.5°C, SBTi | C+ |
| 58 | Citrix Systems Inc | Fort Lauderdale | SBTi | C+ | |
| 59 | UniCredit SpA | Milan | NZBA | C+ | |
| 60 | 67 | Commerzbank AG | Frankfurt am Main | SBTi, NZAM, NZBA | C+ |
| 61 | 37 | ING Groep NV | Amsterdam | NZAM | C+ |
| 62 | Quadient SA | Bagneux | C+ | ||
| 63 | 88 | Henkel AG & Co KgaA | Düsseldorf | 1.5°C, SBTi, NZAM | C+ |
| 64 | 59 | Intel Corp | Santa Clara | C+ | |
| 66† | 77 | Prologis Inc | San Francisco | SBTi | C+ |
| 67 | 65 | Sanofi SA | Paris | 1.5°C, SBTi | C+ |
| 68 | 74 | Analog Devices Inc | Wilmington | 1.5°C, SBTi | C+ |
| 69 | 87 | Kesko Oyj | Helsinki | 1.5°C, SBTi | C+ |
| 70 | 86 | Nordea Bank Abp | Helsinki | NZAM, NZAO, NZBA | C+ |
| 71 | 44 | National Australia Bank Ltd | Melbourne | C+ | |
| 72 | 80 | StarHub Ltd | Singapore | C+ | |
| 73 | 92 | Industria de Diseno Textil SA | Corunna | SBTi, FCCA | C+ |
| 74 | 91 | Teck Resources Ltd | Vancouver | C | |
| 75 | 58 | CapitaLand Investment Ltd | Singapore | SBTi | C |
| 76 | 46 | BNP Paribas SA | Paris | SBTi, NZAM, NZAO, NZBA | C |
| 77 | Puma SE | Herzogenaurach | SBTi, FCCA | C | |
| 78 | 79 | Unilever PLC | London (U.K.) | 1.5°C, SBTi | C |
| 79 | Gildan Activewear Inc | Montreal | C | ||
| 80 | 47 | Bank of Montreal | Montreal | NZAM, NZAO | C |
| 81 | 68 | Cogeco Communications Inc | Montreal | 1.5°C, SBTi | C |
| 82 | 76 | Adidas AG | Herzogenaurach | SBTi, FCCA | C |
| 83 | Coloplast A/S | Humlebæk | 1.5°C, SBTi | C | |
| 84 | 35 | BT Group PLC | London (U.K.) | 1.5°C, SBTi | C- |
| 86† | 73 | Agnico Eagle Mines Ltd | Toronto | C- | |
| 87 | 78 | Lenovo Group Ltd | Quarry Bay | SBTi | C- |
| 88 | 42 | Natura & Co Holding SA | São Paulo | 1.5°C, SBTi | C- |
| 89 | Campbell Soup Co | Camden (U.S.) | SBTi | C- | |
| 90 | 56 | Intesa Sanpaolo SpA | Turin | NZAM, NZAO, NZBA | C- |
| 91 | 82 | AstraZeneca PLC | Cambridge (U.K.) | 1.5°C, SBTi | C- |
| 92 | KBC Groep NV | Brussels | C- | ||
| 93 | 49 | Allianz SE | Munich | SBTi, NZAM, NZAO | C- |
| 94 | Aster DM Healthcare Ltd | Dubai | D+ | ||
| 95 | 89 | Telefonaktiebolaget LM Ericsson | Stockholm | 1.5°C, SBTi | D+ |
| 96 | 75 | Pearson PLC | London (U.K.) | 1.5°C, SBTi | D+ |
| 97 | Biogen Inc | Cambridge (U.S.) | 1.5°C, SBTi | D+ | |
| 98 | 99 | Canadian Tire Corporation Ltd | Toronto | D | |
| 99 | LG Electronics Inc | Seoul | 1.5°C, SBTi | D | |
| 100 | 94 | Byd Co Ltd | Shenzhen | D- |
* Tie
† Rank 30 and 85 updated due to data correction